How to use the Guttman scale in your survey
Sometimes the strength of opinions predicts outcomes better than the opinions themselves.
Take the case of adoption in America. While the vast majority of Americans support the practice of adoption, just 25% support it strongly enough to consider doing it themselves.
To understand the strength of opinions from your key stakeholders, use surveys that employ the Guttman scale.
The Guttman scale determines how strongly a survey respondent holds an opinion by using a series of “yes-no” questions or “agree-disagree” statements. This format helps determine not only what a respondent believes, but how strongly a respondent believes it. If you can gauge the strength of each respondent’s opinion, you can predict real-life outcomes with greater accuracy.
Guttman scale overview
In the mid-20th century, mathematician and social scientist Louis Guttman developed a method to predict which test questions his students got right based solely on their final scores. Guttman would list test questions from least to the most complex, then count down the list until he reached a particular student’s score. Everything above that point, the student got right. Everything below, the student got wrong. He applied this method to his work in social science.
The Guttman scale is based on a hierarchy of related questions. Respondents must answer “yes” or “no” to dichotomous questions that represent an increasingly extreme position on an issue. The more often a respondent answers “yes,” the more that respondent supports a particular opinion. By listing questions from least to most supportive, you can connect the number of times the respondent answers “yes” to a particular opinion.
Examples of the Guttman scale
A Guttman scale survey is a series of related, dichotomous questions or statements. There are many examples of dichotomous questions in SurveyMonkey’s Question Bank. Generally, we advise against using dichotomous questions in surveys unless you’re doing it in a controlled way, like in a Guttman scale. Take this simple question on political views, for example:
Are you a registered voter?
- Yes
- No
The Guttman scale would combine the question above with related questions that represent an increasingly supportive (or, alternatively, critical) position of voting, such as:
Do you vote in every presidential election?
- Yes
- No
Should voting in all elections be mandatory?
- Yes
- No
How do you use the Guttman scale?
You can apply the Guttman scale to a wide range of surveys. Here are some examples for when you’d use it:
- To evaluate cumulative learning. Guttman originally used his scale to evaluate students’ academic achievement.
- To measure opinion. The Guttman scale produces quantifiable measures of the strength of your respondents’ opinions.
- To gauge sentiment. This includes measuring customer satisfaction and employee engagement.
If customer satisfaction is an area of focus, check out our survey methodologist-approved questionnaire templates. And what about employee engagement? We’ve got plenty of templates covering that topic as well.
How do you build a Guttman scale?
Follow these 4 steps to create a survey that utilizes the Guttman scale:
1. Identify a research question that’s related to opinion or sentiment.
2. Generate a series of related “yes-no” questions or “agree-disagree statements” that support the same opinion to varying degrees. The more questions or statements, the more exact your data will be.
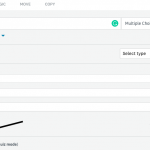
As you put your questions into your SurveyMonkey survey, use the “Score this question (enable quiz mode)” feature or add weight to your matrix/rating scale question.

Simply assign each “yes” or “agree” answer a score of 1 and each “no” or “disagree” answer a score of 0. The score of each quiz represents the respondent’s strength of opinion, where a higher score indicates a more supportive opinion.
3. Order the questions from least to most supportive. While you can order the questions yourself, the risk of bias is lower if a study group takes on the task.
How do you interpret Guttman scale results?
You can compare the Guttman scale results across respondents and groups to measure their relative level of support.
Respondents who have higher final scores hold relatively more supportive opinions than others; while groups that have a higher average score hold more supportive opinions than other groups. Once your responses come back, you’ll be able to make these comparisons using SurveyMonkey Analyze.
Ready to start measuring the strength of your respondents’ opinions? Begin by creating a new survey.
Conheça outros recursos

Diretório de kits de ferramentas
Descubra nossos kits de ferramentas desenvolvidos para te ajudar a aproveitar feedbacks no seu cargo ou seu setor.

Modelos de pesquisas
Explore mais de 400 modelos de questionários personalizáveis criados por especialistas. Crie e envie questionários rapidamente com a SurveyMonkey.

Como calcular o valor de p
Saiba como calcular o valor de p com nosso guia passo a passo ou use nossa calculadora de valor p. É fácil!

Você pediu, nós criamos: apresentamos nosso novo recurso de análise de vários questionários
O novo recurso de análise de vários questionários da SurveyMonkey permite combinar e analisar resultados de pesquisas diferentes em um só lugar.